I’ve always wondered why chickens lay so many eggs, around 300 per year1! Were they designed perfectly just to cater to humans? Is it the sole ‘purpose’ of their lives? Do we eat eggs because chickens lay excess eggs? Or do chickens lay more eggs because we eat them?
Another question naturally to ask then would be, why do junglefowls who look very similar to a chicken just lay 10-15 eggs per year2? Just considering the phenotypic similarities, we can assume they share a common ancestry, and indeed the red junglefowl is the direct ancestor of the domestic chicken 3.
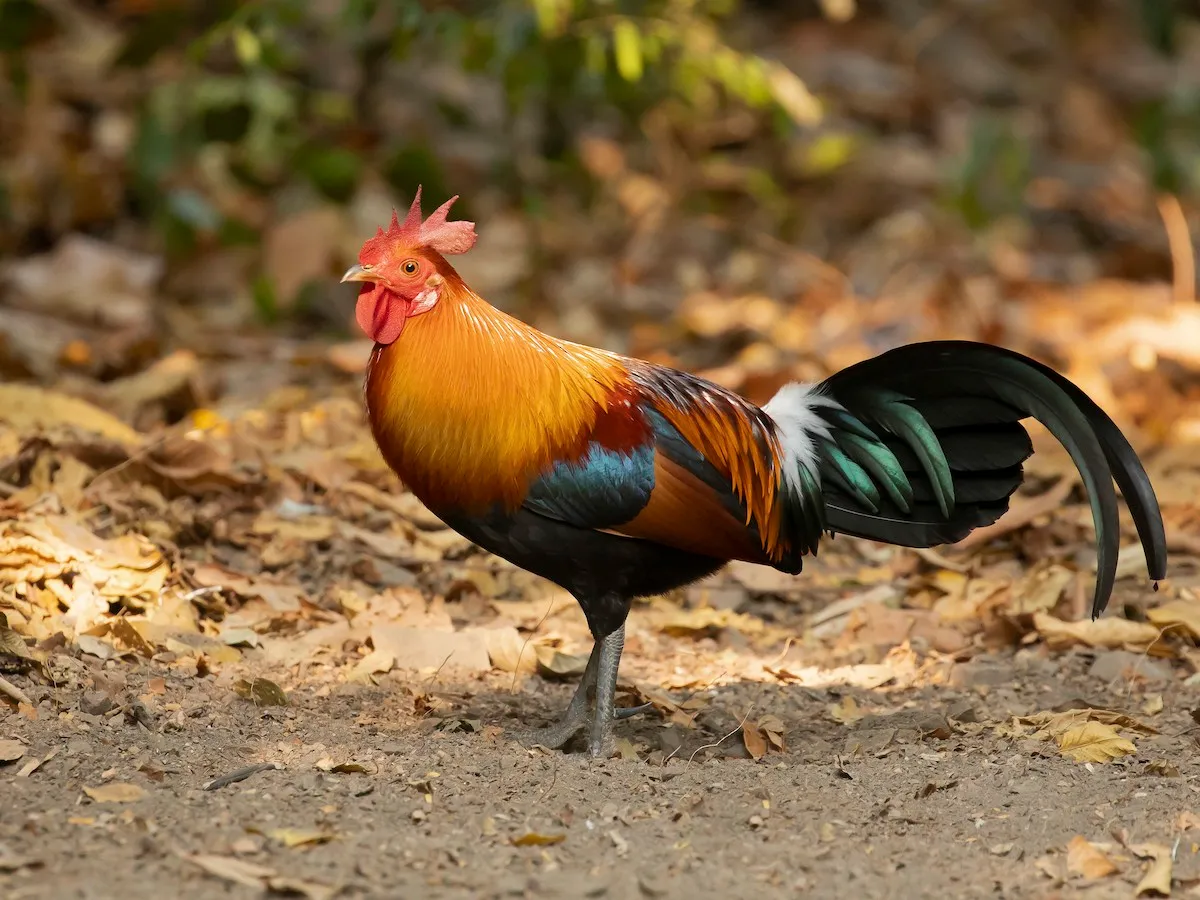
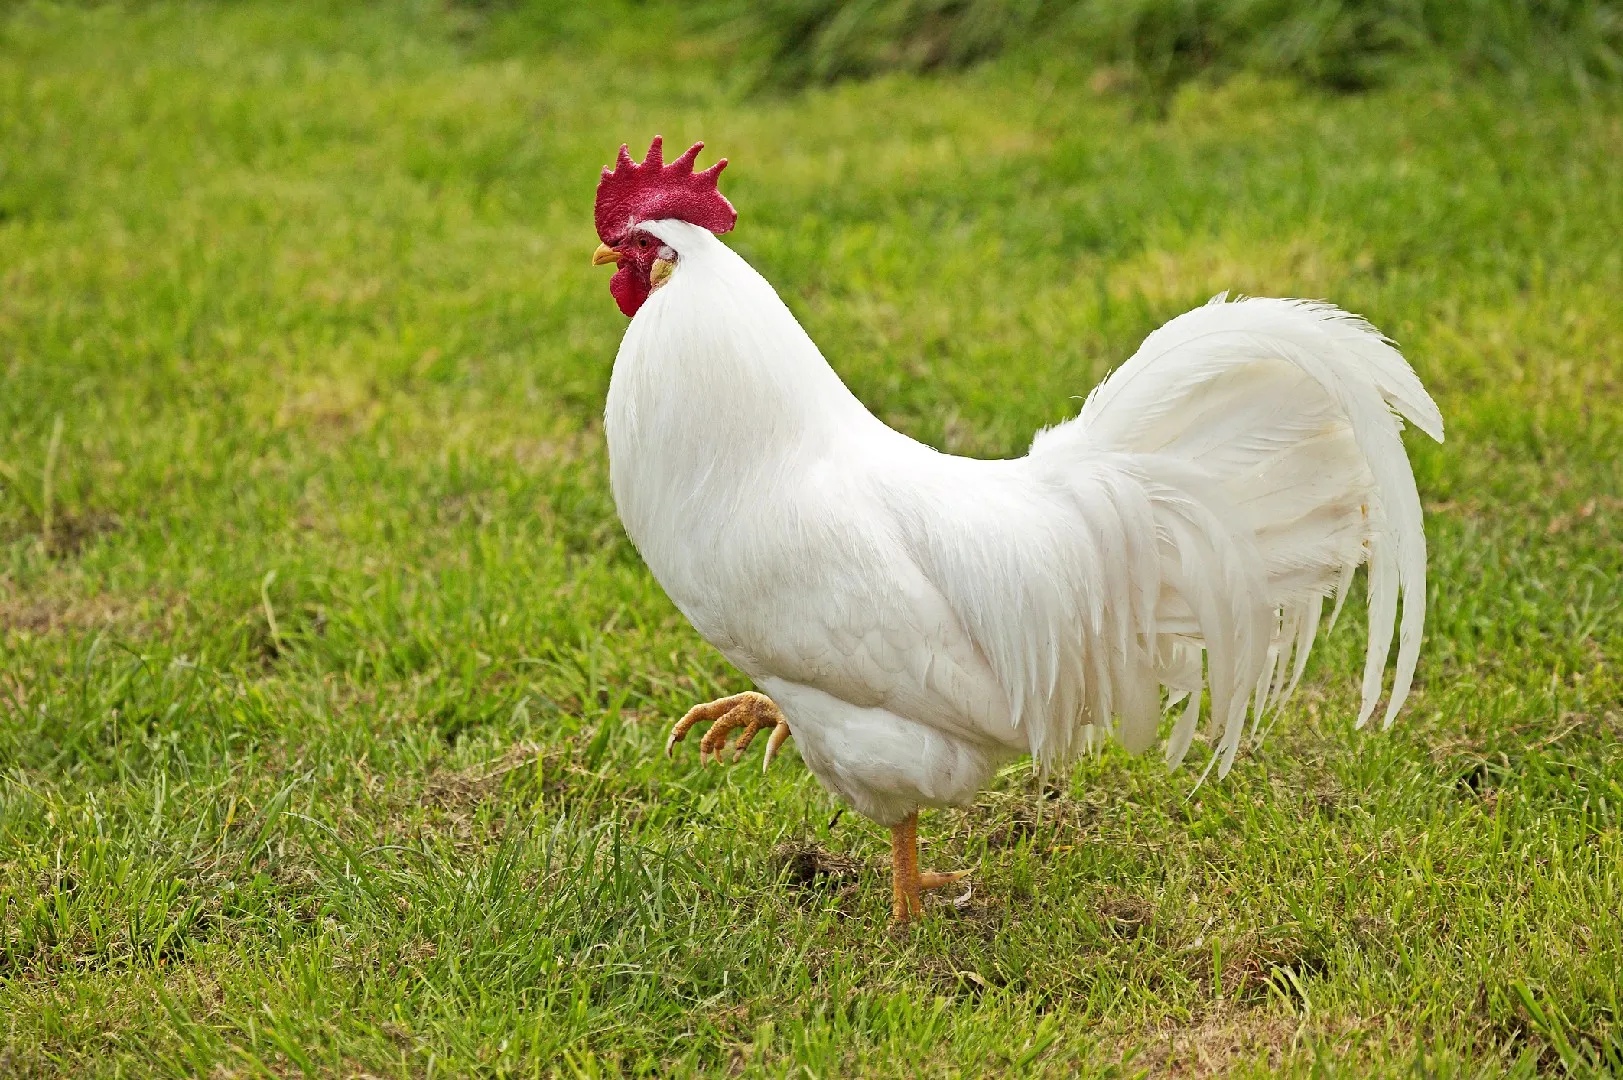
But what naturally occurring selective pressures affected a junglefowl to evolve to a chicken laying 300 eggs annually? Was the rate of hatching so small that more eggs meant more hatching? In the wild, laying 300 eggs is biologically useless. A junglefowl can only physically cover and incubate about 10 to 15 eggs at a time. Any egg laid beyond her wingspan simply rots or gets eaten by predators, making it a 100% waste. Then what naturally occurring selective pressure could possibly drive a species to sacrifice bone density, causing osteoporosis, just to produce more eggs? 4
The answer to above isn’t ‘Natural Selection’, it’s ‘Artificial Selection’. Artificial selection is an evolutionary process in which humans consciously select for or against particular features in organisms5.
It’s a bit counter-intuitive to grasp at once due to large time scales needed for an observable change. I cannot take a Junglefowl and turn into a chicken during my lifetime. There are similar examples that are results of artificial selection. Whenever you come across a ‘natural’ organism that looks perfectly designed for a human, more often than not, it’s the result of artificial selection. See the Dogs and the Human Bonding Loop, further down for another example.
Pivoting back to chickens, chicken domestication is now dated to around 3,500 years ago in Southeast Asia 3. However, exact figures of eggs laid per year are not known. What we do have is the more recent figures from the 1950s. U.S. layer-performance data shows hens averaging 56.9% hen-day egg production in 1950 (about 208 eggs/year) and 82.0% by 2000 (about 299 eggs/year), a direct signature of sustained artificial selection1.
This is a result of intense breeding programs starting from the 1920s-30s. Before this shift, farmers couldn’t ignore other survival traits entirely, since hens were largely reared outdoors and needed to fend for themselves. The move to indoor battery cages in the 1930s-40s marked a turning point. Since they were insulated from predators, weather, and the need to forage, breeders could focus almost exclusively on egg output. By 1950, this had already pushed egg-laying to multiples of what a wild red junglefowl manages. The following half-century saw a further ~44% increase in egg production. At a typical layer-breeding generation interval of about 14.5 months, that’s roughly only 41 generations to go from 208 to 299 eggs a year6.
With this extreme, single-minded selection pressure on egg yield, industrial breeding has produced chickens that lay around 300 eggs a year while sacrificing other survival traits, including bone density4. A domestic chicken released into the same environment as a junglefowl would likely not survive for long.
Simulation
Code: github.com/kaushithamsilva/artificial-selection
This is a simulation of the above effect to demonstrate artificial selection. It’s nowhere near to a real world evolution demo, but nevertheless very interesting.
Let’s assume that in my world the coding unit is a 32-bit long string (instead of DNA), and there are 3 genes: Egg Yield (), Bone Density Capacity (), and Energy Capacity (), each taking 3 bits. The rest of the 23 bits are non-coding, they never touch the phenotype. Each 3-bit block decodes as ordinary MSB-first binary.
A worked example of the representation
- bits[0:3] = 111 → E = 4+2+1 = 7 (maximum egg yield)
- bits[10:13] = 010 → B = 0+2+0 = 2 (low bone capacity)
- bits[20:23] = 100 → N = 4+0+0 = 4 (moderate energy capacity)
- the other 23 bits are junk, ignored entirely.
A mutation in this world is a bit flip (0 → 1, 1 → 0). The mutation rate is set at 0.03 per bit, meaning we expect an average of about one random bit-flip per offspring. The crossover mechanism used is the typical single-point crossover used in Genetic Algorithms. We pick one random pivot position along the 32-bit genome (uniformly in [1, 31]), the child takes all bits up to and including the pivot from parent A, and all remaining bits after the pivot from parent B.
A worked example of reproduction
Recombination
Single-point crossover at bit index 15. Offspring takes bits 0–15 from Parent 1, bits 16–31 from Parent 2.
Mutation
Bit index 2 flips from 0 to 1.
Selection and Fitness
To decide which individuals reproduce, the simulation uses roulette wheel selection (fitness-proportionate selection). In other words, higher the fitness score, higher the probability of getting selected as a parent.
To come up with a fitness function, I assumed laying eggs to be an expensive process that costs both energy and calcium, thus reducing both and .
- Eggshells require huge amounts of calcium. When a hen lays eggs continuously, her body pulls calcium directly out of her bones.
- Producing eggs burns daily energy. Every egg laid drains energy
Here and are genetic capacities decoded straight from the genome. It’s the ceiling the genotype allows, not the actual bone density or energy levels expressed. What the bird actually expresses, and , is that capacity minus whatever egg-laying has already depleted. There is no separate “expressed” value for .
I assume that the bird needs at least 2 units of bone density and energy to survive. If either drops below this threshold, her fitness score is drastically reduced. To model this, a smooth step function is used.
Because and directly drop as rises, pushing egg production too high under natural selection reduces the bird’s fitness, leading to a smaller slice of the wheel. Under artificial selection, the farmer ignores bones and energy entirely (), meaning high egg producers always take the largest slice of the wheel regardless of how depleted their bodies become.
Results
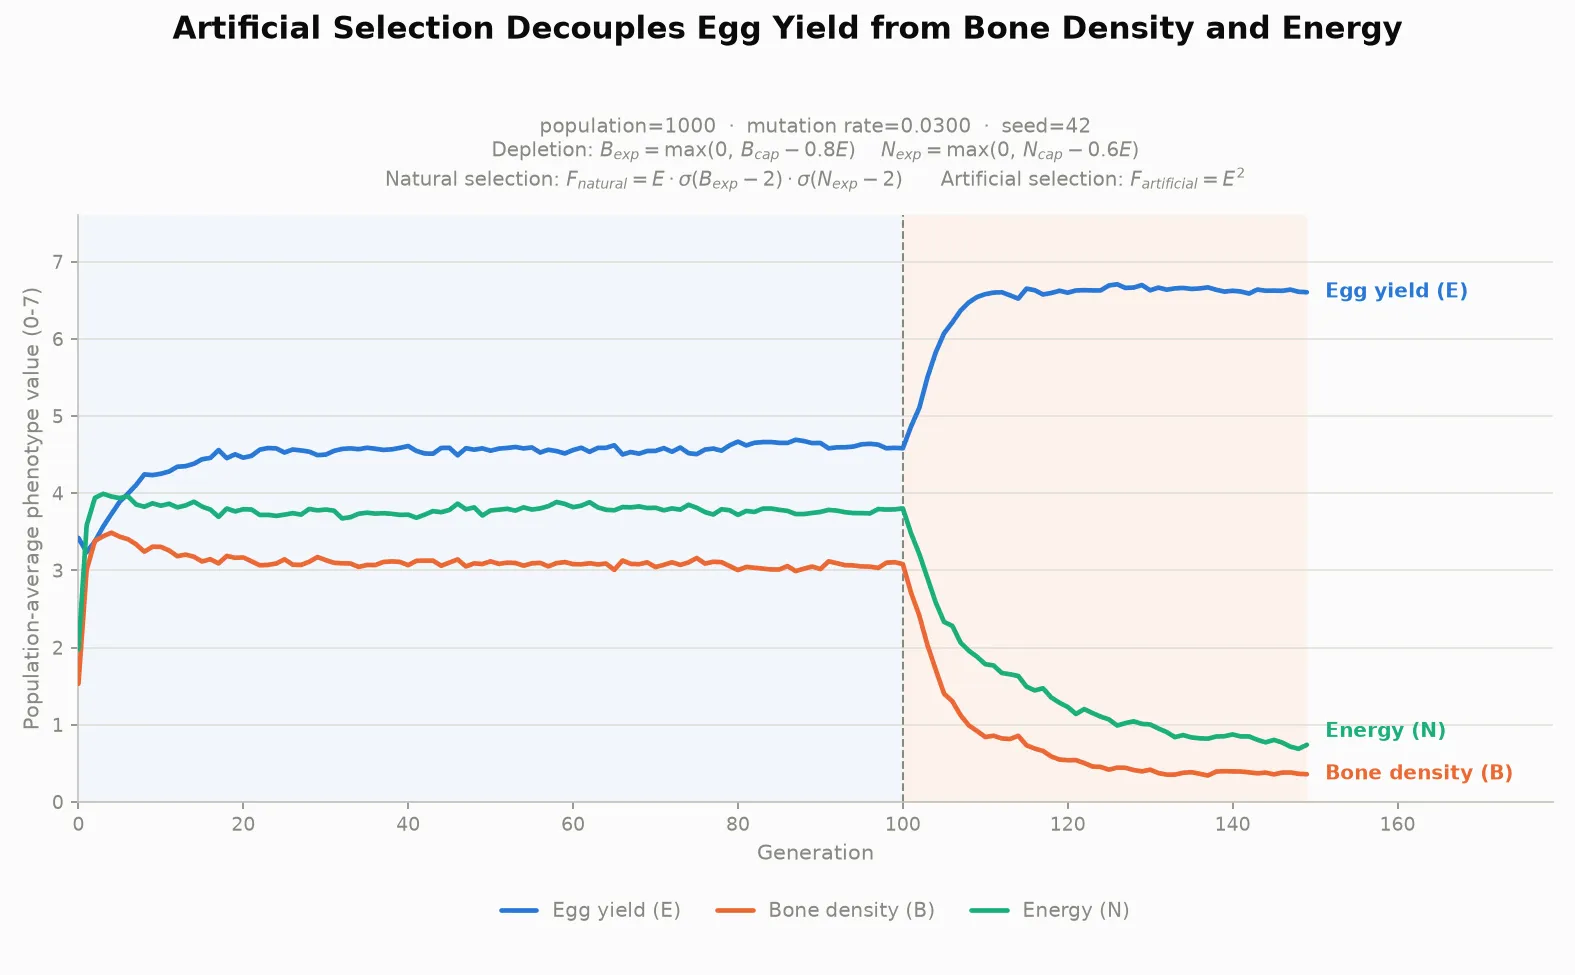
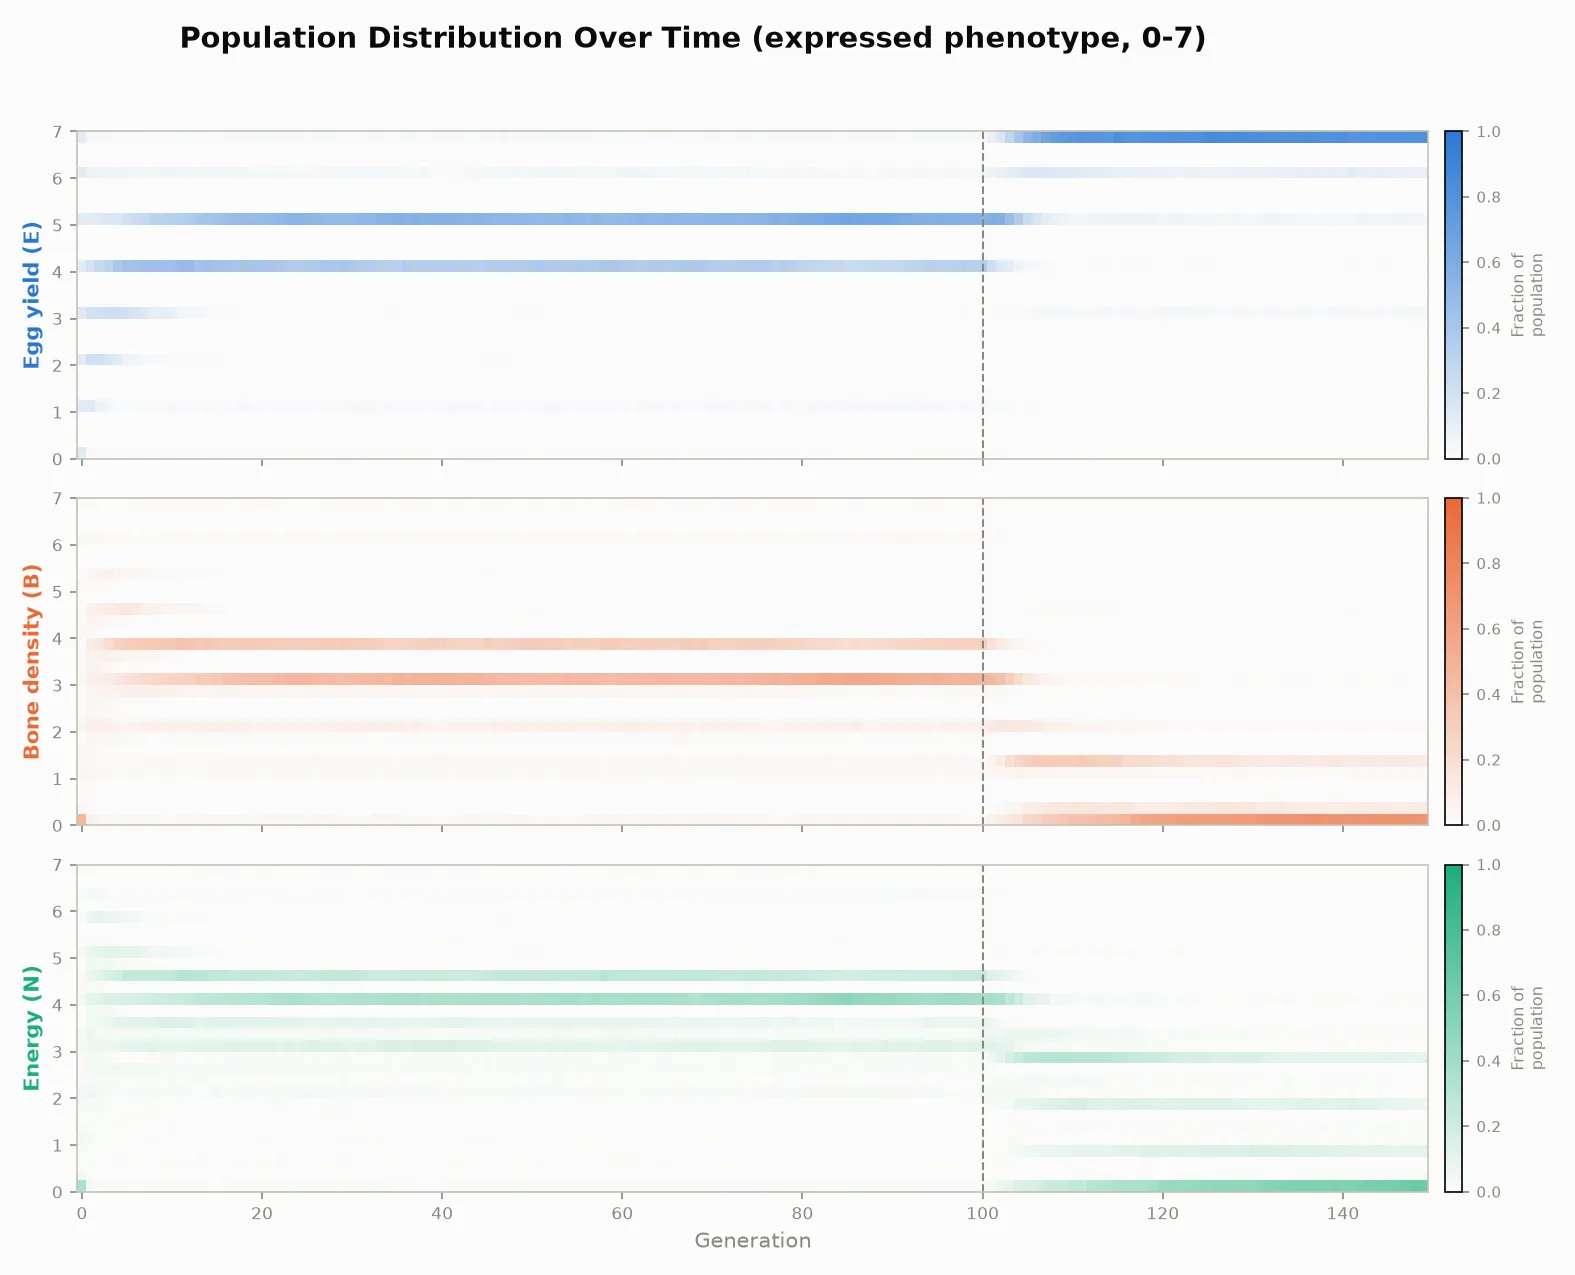
As Figure 1 indicates, 100 generations of natural selection in the wild results in the average , , and stabilizing at about 4.6, 3.8, and 3.1 units. When the artificial selection phase starts, the average increases and converges at around 6.6 units, while and drop down to ~0.7 and ~0.35 units. Figure 2 shows the population fraction distribution of , , and across generations; it shows that while there is some residual variation in and in the artificially selected population, they remain substantially lower than in the wild population.
Although the above is a rather simplified simulation of the domestication of chickens, it highlights how artificial selection can drive rapid and dramatic phenotypic divergence compared to natural selection over very short spans of time. To answer the question posed at the start: in simple terms, humans wanted to eat more eggs, and by selectively breeding chickens that laid more eggs over many generations, chickens now lay 300 eggs/year (a figure that industrial breeding may push even higher).
Another Example: Dogs and the Human Bonding Loop
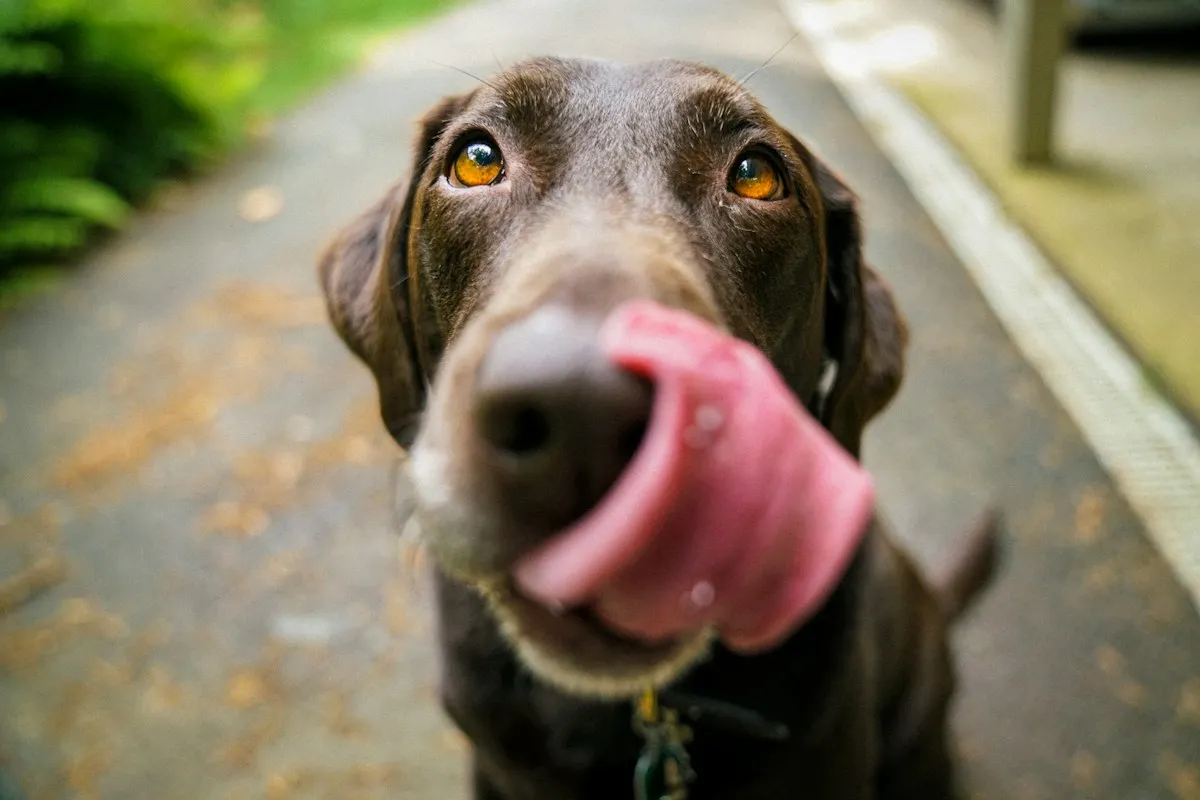
Dogs have human-like behaviors and facial expressions, almost as if they were designed to be our companions. Recent genomic evidence confirms dogs were the very first domesticated animals7. Over thousands of years of living alongside humans, selection favored traits that tapped directly into our nurturing instincts. Research shows that mutual eye contact between a dog and its human triggers a surge of oxytocin, the same hormone involved in maternal bonding in both species8. Dogs have even evolved specialized facial muscles (like the levator anguli oculi medialis) that wolves lack, allowing them to raise their inner eyebrows and produce expressive “puppy dog eyes” that us humans instinctively care for9. I’m not entirely sure whether to classify this as artificial selection or interspecies co-evolution, but it’s certain that human preference directly shaped their anatomy and social cognition.
Footnotes
-
Kidd, M. T. & Anderson, K. E. Laying hens in the U.S. market: An appraisal of trends from the beginning of the 20th century to present. Journal of Applied Poultry Research 28, 771–784 (2019). States domestication occurred “3,500 to 4,000 yr ago in Asia”; Table 4 gives U.S. layer hen-day egg production of 56.9% in 1950 and 82.0% in 2000 (≈208 and ≈299 eggs/year respectively), with age at 50% egg production falling from 182.9 to 138.8 days over the same period. https://doi.org/10.3382/japr/pfz043 ↩ ↩2
-
Collias, N. E. & Collias, E. C. A field study of the red jungle fowl in North-Central India. The Condor 69(4), 360–386 (1967). https://doi.org/10.2307/1366199 ↩
-
Peters, J. et al. The biocultural origins and dispersal of domestic chickens. PNAS 119(24), e2121978119 (2022). A reassessment of chicken remains from >600 archaeological sites in 89 countries, dating unambiguous domestic chickens to ~1650–1250 BCE in Thailand (~3,300–3,700 years ago), and explicitly arguing that older genomic divergence-time estimates (6,200–12,800 years ago) should not be equated with the domestication event itself. https://www.pnas.org/doi/10.1073/pnas.2121978119 ↩ ↩2
-
Rubin, C.-J. et al. Differential gene expression in femoral bone from red junglefowl and domestic chicken, differing for bone phenotypic traits. BMC Genomics 8, 208 (2007). cDNA-microarray comparison of femoral bone from red junglefowl and White Leghorn hens (intensively selected for egg production) found 779 differentially expressed transcripts, including systematically lower expression of ribosomal-protein and translation-factor genes in the domestic breed. White Leghorns had ~50% higher bone mineral density than junglefowl at peak bone mass (40 weeks), but the paper notes this is followed by the osteoporosis characteristic of egg-laying breeds, driven by medullary bone remodeling during the lay cycle. https://link.springer.com/article/10.1186/1471-2164-8-208 ↩ ↩2
-
Understanding Evolution, UC Berkeley Museum of Paleontology. “Artificial Selection.” Defines artificial selection as humans “consciously select[ing] for or against particular features in organisms,” using the cauliflower/broccoli/cabbage/kale-from-wild-mustard example and dog breeding as illustrations; note its dog-domestication estimate (20,000–40,000 years ago) is a general-audience figure, distinct from the specific dated evidence in 7. https://evolution.berkeley.edu/lines-of-evidence/artificial-selection/ ↩
-
Büttgen, L., Simianer, H. & Pook, T. Analysis of different genotyping and selection strategies in laying hen breeding programs. Genetics Selection Evolution 57, 20 (2025). States a conventional layer-breeding generation interval of ~14.5 months (per Sitzenstock et al.), reducible to ~6 months with genomic selection. https://pmc.ncbi.nlm.nih.gov/articles/PMC11974122/ ↩
-
Marsh, W. A. et al. Dogs were widely distributed across western Eurasia during the Palaeolithic. Nature 651, 995–1003 (2026). Nuclear and mitochondrial genomes from canid remains at Pınarbaşı, Türkiye (~15,800 years ago) and Gough’s Cave, UK (~14,300 years ago), analyzed alongside 68 ancient dog and 71 ancient wolf genomes, show a genetically homogeneous dog population already widespread across Europe and Anatolia by the Late Upper Palaeolithic — roughly 4,900 years earlier than the previous confidently-dated evidence (~10,900 years ago), making dogs by far the earliest confirmed domesticated animal. https://www.nature.com/articles/s41586-026-10170-x ↩ ↩2
-
Nagasawa, M. et al. Oxytocin-gaze positive loop and the coevolution of human-dog bonds. Science 348(6232), 333–336 (2015). Demonstrates that mutual gazing between dogs and their owners increases urinary oxytocin concentrations in both owners and dogs, facilitating interspecies social bonding, a mechanism absent between wolves and hand-raisers. https://doi.org/10.1126/science.1261022 ↩
-
Kaminski, J. et al. Evolution of facial muscle anatomy in dogs. PNAS 116(29), 14677–14681 (2019). Anatomical comparison showing domestic dogs possess the levator anguli oculi medialis muscle to raise their inner eyebrows into expressive “puppy dog eyes,” an anatomical feature systematically absent or vestigial in grey wolves. https://doi.org/10.1073/pnas.1820653116 ↩